empty
22.01.2023 07:29 PM
Weekly Review of GBP/USD for January 22, 2023

This image is no longer relevant

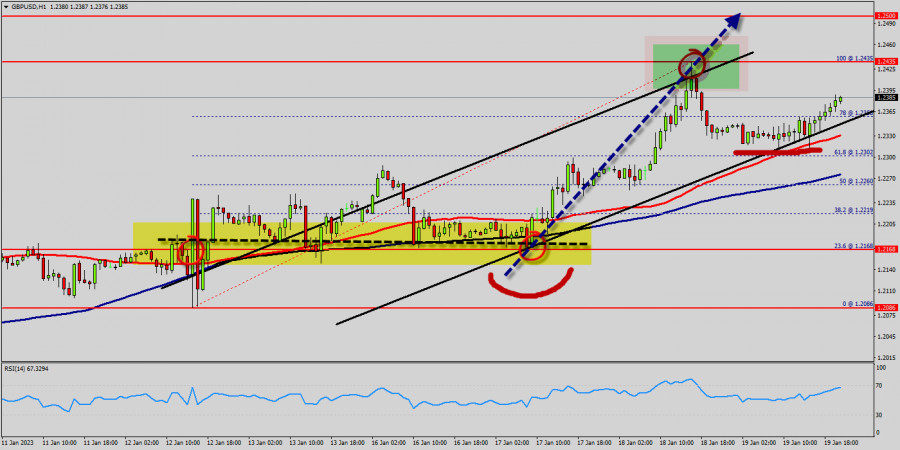
Weekly Review :The GBP/USD pair can still form an ascending impulse, it continues to rise upwards. The major support is seen at 1.2302 which coincides with the ratio of 61.8% Fibonacci. According to the main scenario, it may start forming correctional structures. Today, we foresee the price to move towards the level of 1.2336 and then reach a new maximum again around the price of 1.2435. Please, note that the strong resistance stands at the level of 1.2435. If the price breaks the level of 1.2435, we expect potential testing of 1.2500. The current ascending structure implies that the market may reach the level of 1.2500. In this area, the trend is challenging a major resistance level. The ascending impulse is strong enough to buy above the support of 1.2302. Additionally, the RSI is still calling for a strong bullish market as well as the current price is also above the moving average 100.

It will be advantageous to buy above the support area of 1.2302. Therefore, the price is expected to reach a high once again. It is rather gainful to buy at 1.2302 with the targets at 1.2435 and 1.2500. So, it is recommended to place take profit at the price of 1.2500 as the second target today. The market is indicating a bullish opportunity above the above-mentioned support levels, for that the bullish outlook remains the same as long as the 100 EMA is headed to the upside. On the contrary, stop loss should be placed at the price of 1.2302 (below the daily support). The bullish outlook remains the same as long as the RSI indicator is pointing to the upside on the one-hour chart. However, if the GBP/USD pair fails to break through the resistance level of 1.2435 today, the market will decline further to 1.2168 in coming days.

This image is no longer relevant

The GBP/USD pair remains up for the day, trading at around 1.2336. Renewed US Dollar demand pushed the pair away from an intraday high of 1.2435, its highest in a month. The UK annualized Consumer Prices Index came in at 10.5% in last month easing from 10.7% nowadays. Current price sets at the price of 1.2336.

The double bottom is also coinciding with the major support this week. Additionally, the RSI is still calling for a strong bullish market as well as the current price is also above the moving average 100. Therefore, it will be advantageous to buy above the support area of 1.2241. Commonly, traders use the RSI (Relative Strength Index) to define what? Areas that are potentially overbought or oversold.

Overall, RSI readings below 30 indicate that the pair is oversold, while RSI readings over 70 indicate that it is overbought. Buyers would then use the next resistance located at 1.2315 as an objective. Crossing it would then enable buyers to target 1.2305 (the double top - last bullish yesterday). Be careful, given the powerful bullish rally underway, excesses could lead to a possible correction in the short term. If this is the case, remember that trading against the trend may be riskier.

It would seem more appropriate to wait for a signal indicating reversal of the trend. The GBP/USD pair price could be awaiting a major upswing if the digital savings manages to slice above a fatal line of the first resistance that sets at the price of 1.2315 (Horizontal red line). Re-buy orders are recommended above the major resistance rates of (1.2315) with the second target at the level of 1.2393. Furthermore, if the trend is able to breakout through the second resistance level of 1.2393. We should see the pair climbing towards the next target of 1.2400 The pair will move upwards continuing the development of the bullish trend to the level 1.2425. It might be noted that the level of 1.2425 is a good place to take profit because it will form a new double top in coming hours.

The general bullish opinion of this analysis is in opposition with technical indicators. As long as the invalidation level of this analysis is not breached, the bullish direction is still favored, however the current short-term correction should be carefully watched. The bulls must break through 1.2315 in order to resume the uptrend. Next target 1.2600 in coming days.

Mourad El Keddani,
الخبير التحليلي لدى شركة إنستافوركس
© 2007-2025
حدد الإطار الزمني
5
د
15
د
30
د
1
س
4
ساعات
1
يوم
1
أسبوع
كسب عائد من تغيرات أسعار العملات المشفرة مع إنستافوركس.
قم بتحميل منصة التداول ميتاتريدر 4 وافتح أول صفقة.
  • Grand Choice
    Contest by
    InstaForex
    InstaForex always strives to help you
    fulfill your biggest dreams.
    انضم إلى المسابقة

المقالات الموصى بها

إشارات التداول للذهب (XAU/USD) للفترة من 23 إلى 25 يوليو 2024: الشراء فوق $2,389 (ارتداد - 5/8 Murray)

يتداول الذهب حول 2,402.86 تحت قناة الاتجاه الهابط التي تشكلت منذ 17 يوليو وداخل قناة الاتجاه الصاعد التي تشكلت بعد الوصول إلى أدنى مستوى عند 2,384. يبقى الذهب

Dimitrios Zappas 17:01 2024-07-23 UTC+2

GBP/USD: نصائح التداول للمبتدئين للجلسة الأوروبية في 25 يونيو

حدث اختبار السعر عند 1.2672 عندما كان مؤشر MACD يبدأ في الارتفاع من العلامة الصفرية، مما أكد نقطة الدخول الصحيحة لشراء الجنيه. ونتيجة لذلك، ارتفع زوج GBP/USD بأكثر

Jakub Novak 09:11 2024-06-25 UTC+2

تحليل ونصائح تداول لزوج الجنيه الإسترليني مقابل الدولار الأمريكي في 15 أبريل

تحليل للمعاملات ونصائح لتداول زوج الجنيه الإسترليني مقابل الدولار الأمريكي أصبح الانخفاض الإضافي محدودًا لأن اختبار 1.2477 حدث في وقت تحركت فيه خط MACD بقوة نحو الأسفل من الصفر. بينما

Jakub Novak 09:10 2024-04-15 UTC+2

مراجعة أسبوعية عن GBP/USD في الفترة من 26 إلى 30 نوفمبر 2023

تم تحديد السعر الحالي عند مستوى 1.2423 الذي يعمل كنقطة دعم يومية تم رؤيتها عند 1.2434. ومن الأهمية الكبيرة أن السعر يتحرك في قناة صاعدة. ووفقًا للأحداث السابقة، نتوقع

Mourad El Keddani 18:57 2023-11-26 UTC+2

مراجعة أسبوعية حول زوج العملات EUR/USD في الفترة من 26 إلى 30 نوفمبر 2023

مراجعة: كان اتجاه زوج اليورو/الدولار الأمريكي متناقضًا حيث حدث في قناة الاتجاه الهابط. نظرًا للأحداث السابقة، لا يزال السعر محصورًا بين مستويات 1.0850 و 1.0773، لذا يُنصح بالحذر عند إجراء

Mourad El Keddani 18:45 2023-11-26 UTC+2

مراجعة أسبوعية لزوج الجنيه الإسترليني/الدولار الأمريكي في 20-24 نوفمبر 2023

مراجعة: كان اتجاه زوج الجنيه الاسترليني / الدولار الأمريكي متناقضًا حيث حدث في قناة الاتجاه الهابط. نظرًا للأحداث السابقة ، لا يزال السعر محددًا بين مستويات 1.2291 و 1.2153 ،

Mourad El Keddani 19:45 2023-11-20 UTC+2

مراجعة أسبوعية حول زوج العملات EUR/USD في الفترة من 20 إلى 24 نوفمبر 2023

كانت الاتجاه في زوج اليورو/الدولار الأمريكي متجادلاً حيث كان يتداول في قناة جانبية ضيقة، وأظهرت السوق علامات على عدم الاستقرار. وفي ظل الأحداث السابقة، لا يزال السعر يتحرك بين مستويات

Mourad El Keddani 19:34 2023-11-20 UTC+2

مراجعة أسبوعية عن GBP/USD في 11 نوفمبر 2023

من المتوقع أن يعاود الاتجاه الهابط القصير الأجل إعادة ضبط الاتجاه الطبيعي أو الهابط بسرعة. لتجنب التعارض مع الفترة القصيرة، يمكن تفضيل المراكز القصيرة (للبيع) لزوج الجنيه الإسترليني / الدولار

Mourad El Keddani 19:48 2023-11-11 UTC+2

مراجعة أسبوعية حول زوج العملات EUR/USD في 11 نوفمبر 2023

مراجعة أسبوعية: كان اتجاه زوج اليورو/الدولار الأمريكي متناقضًا حيث حدث في قناة الاتجاه الهابط. نظرًا للأحداث السابقة، لا يزال السعر محصورًا بين مستويات 1.0850 و 1.0773، لذا يُنصح بالحذر

Mourad El Keddani 19:41 2023-11-11 UTC+2

مراجعة أسبوعية لزوج اليورو/الدولار الأمريكي للفترة من 30 إلى 31 أكتوبر 2023

ضرب زوج اليورو/الدولار الأمريكي نقطة الدعم الأسبوعية والمقاومة 1، بسبب سلسلة من القمم المتساوية والقيعان المتساوية نسبيًا. ولكن، ارتفع الزوج ليصل إلى نقطة 1.0588. وبالتالي، تم تحديد الدعم الرئيسي بالفعل

Mourad El Keddani 22:52 2023-10-30 UTC+2
لا تستطيع التحدث الآن؟
اطرح سؤالك في الدردشة.
Widget callback
 

Dear visitor,

Your IP address shows that you are currently located in the USA. If you are a resident of the United States, you are prohibited from using the services of InstaFintech Group including online trading, online transfers, deposit/withdrawal of funds, etc.

If you think you are seeing this message by mistake and your location is not the US, kindly proceed to the website. Otherwise, you must leave the website in order to comply with government restrictions.

Why does your IP address show your location as the USA?

  • - you are using a VPN provided by a hosting company based in the United States;
  • - your IP does not have proper WHOIS records;
  • - an error occurred in the WHOIS geolocation database.

Please confirm whether you are a US resident or not by clicking the relevant button below. If you choose the wrong option, being a US resident, you will not be able to open an account with InstaForex anyway.

We are sorry for any inconvenience caused by this message.