empty
07.04.2023 12:06 AM
Technical analysis of EUR/USD for April 06, 2023

This image is no longer relevant

Overview :

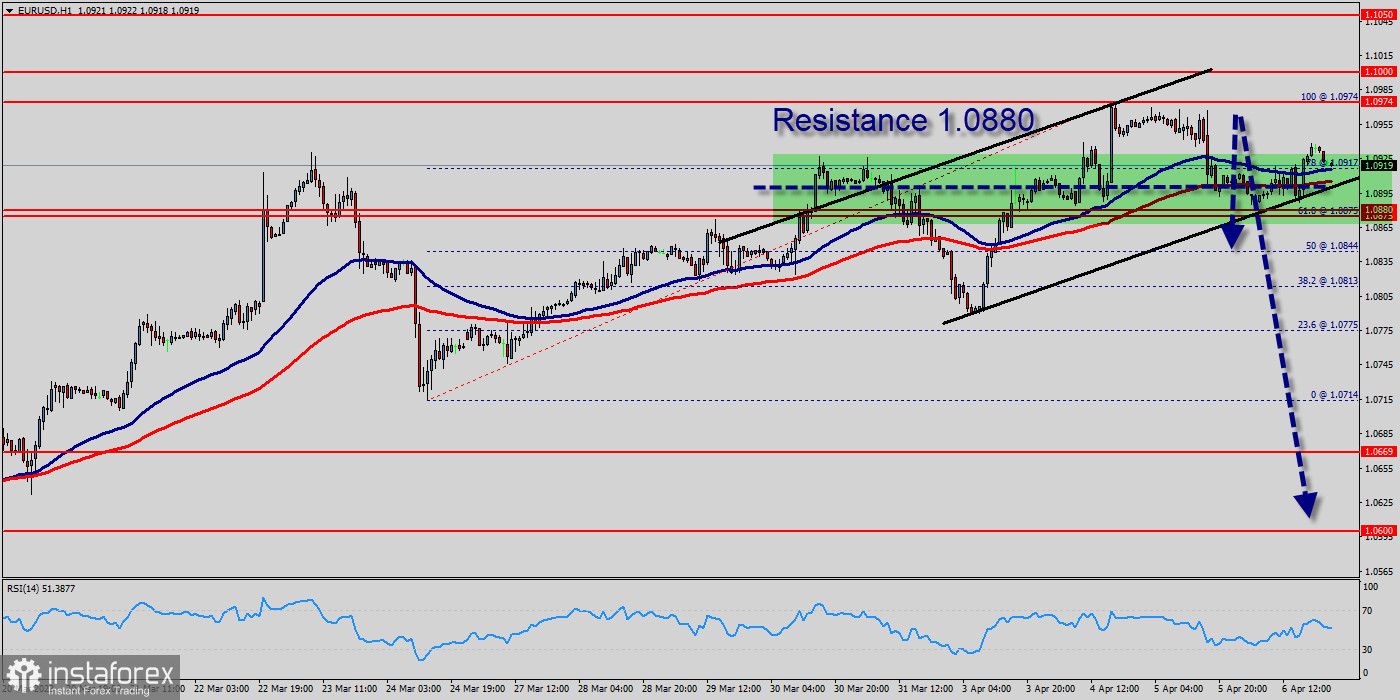
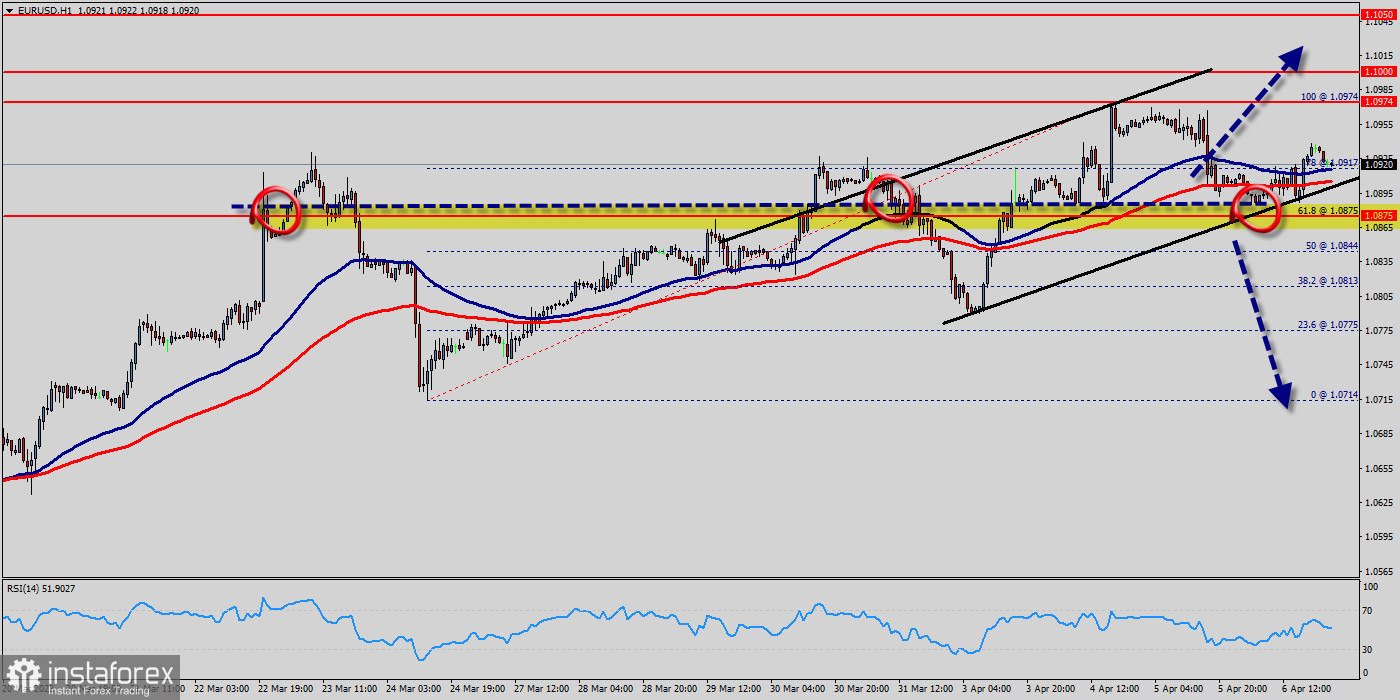
Since last week, the EUR/USD pair has faced strong resistances at the levels of 1.0880 because support had become resistance last week. So, the strong resistance has been already formed at the level of 1.0880 and the pair is likely to try to approach it in order to test it again. However, if the pair fails to pass through the level of 1.0880, the market will indicate a bearish opportunity below the new strong resistance level of 1.0880 (the level of 1.0880 coincides with a ratio of 61.8% Fibonacci - last bullish wave - double top).

Moreover, the RSI starts signaling a downward trend, as the trend is still showing strength above the moving average (100) and (50). The trend of EUR/USD pair movement was controversial as it took place in the downtrend channel. Due to the previous events, the price is still set between the levels of 1.0808 and 1.0669, so it is recommended to be careful while making deals in these levels because the prices of 1.0808 and 1.0669 are representing the resistance and support respectively.

It is necessary to wait till the downtrend channel is passed through. Then the market will probably show the signs of a bearish market. It should be noted that the volatility is very high for that the price of the EUR/USD pair is still trading between the prices of 1.0669 and 1.0808 in the coming hours. Furthermore, the price has been set below the strong resistance at the levels of 1.0808 and 1.0851 which coincide with the ratios of Fibonacci retracement levels respectively. Thus, the market is indicating a bearish opportunity below 1.0880 so it will be good to sell at 1.0808 with the first target of 1.0669.

It will also call for a downtrend in order to continue towards 1.0630. The daily strong support is seen at 1.0600. However, the stop loss should always be taken into account, for that it will be reasonable to set your stop loss at the level of 1.0851. Moving averages, in the meantime, maintain their bearish slope way above the current level.

Furthermore, although the news is bearish for the EUR/USD pair, professional may not want to sell weakness, but rather following a rebound rally. Additionally, some aggressive counter-trend buyers may be defending parity. In case a continuisions takes place and the EUR/USD pair breaks through the support level of 1.0669, a further decline to 1.0600 can occur which would indicate a bearish market.

The EUR/USD pair didn't make any significant movements yesterday. There are no changes in our technical outlook. The bias remains bearish in the nearest term testing 1.0669 or lower. Immediate support is seen around 1.0669. A clear break below that area could lead price to the neutral zone in the nearest term. Price will test 1.06030, because in general, we remain bearish on between Feb 13rd and Feb 18th, 2023. The market moved from its bottom at 1.0669 and continued to rise towards the top of 1.0680. Today, on the one-hour chart, the current rise will remain within a framework of correction.

This image is no longer relevant

However, if the pair fails to pass through the level of 1.0732 (major resistance), the market will indicate a bearish opportunity below the strong resistance level of 1.0669 (the level of 1.0669 coincides with the ratio of 00% Fibonacci retracement - last bearish wave). This resistance has been rejected several times confirming the downtrend. Additionally, the RSI starts signaling a downward trend.

The trend is still below the 100 EMA for that the bearish outlook remains the same as long as the 100 EMA is headed to the downside. Since there is nothing new in this market, it is not bullish yet. Sell deals are recommended below the level of 1.0669 with the first target at 1.0630 so as to test the double bottom. If the trend breaks the double bottom level of 1.0600, the pair is likely to move downwards continuing the development of a bearish trend to the level of 1.0600 in order to test the weekly support 2. The third weekly support is set at the price of 1.0543.

Mourad El Keddani,
الخبير التحليلي لدى شركة إنستافوركس
© 2007-2025
حدد الإطار الزمني
5
د
15
د
30
د
1
س
4
ساعات
1
يوم
1
أسبوع
كسب عائد من تغيرات أسعار العملات المشفرة مع إنستافوركس.
قم بتحميل منصة التداول ميتاتريدر 4 وافتح أول صفقة.
  • Grand Choice
    Contest by
    InstaForex
    InstaForex always strives to help you
    fulfill your biggest dreams.
    انضم إلى المسابقة

المقالات الموصى بها

التحليل الفني لحركة السعر اللحظية لأزواج العملات المتقاطعة AUD/JPY، الأربعاء، 23 أبريل 2025.

مع ظهور تباين بين حركة سعر زوج العملات المتقاطع AUD/JPY مع مؤشر مذبذب ستوكاستيك وحركة سعر AUD/JPY التي تقع فوق المتوسط المتحرك المرجح (30 إزاحة 2) والذي لديه أيضًا

Arief Makmur 06:37 2025-04-23 UTC+2

التحليل الفني لحركة السعر اليومية لأداة سلعة الذهب، الأربعاء، 23 أبريل 2025.

إذا نظرنا إلى الرسم البياني لمدة 4 ساعات، يبدو أن أداة السلع الذهبية لا تزال تتحرك في اتجاه صعودي، ولكن مع ظهور تباين بين حركة سعر الذهب ومؤشر مذبذب ستوكاستيك،

Arief Makmur 06:37 2025-04-23 UTC+2

توقعات الفوركس 22/04/2025: اليورو/الدولار الأمريكي، الجنيه الإسترليني/الدولار الأمريكي، الدولار الأمريكي/الين الياباني وبيتكوين

روابط مفيدة: مقالاتي الأخرى متوفرة في هذا القسم دورة InstaForex للمبتدئين التحليلات الشائعة افتح حساب تداول مهم: يجب على المبتدئين في تداول الفوركس أن يكونوا حذرين للغاية عند اتخاذ القرارات

Sebastian Seliga 10:08 2025-04-22 UTC+2

التحليل الفني لحركة السعر اللحظية لأزواج العملات المتقاطعة GBP/CHF، الثلاثاء 22 أبريل 2025.

إذا نظرنا إلى الرسم البياني لمدة 4 ساعات لزوج العملات المتقاطع GBP/CHF، نجد عدة حقائق مثيرة للاهتمام. أولاً، ظهور نمط المثلث متبوعًا بحركة المتوسط المتحرك الأسي (21) الذي يتحرك

Arief Makmur 06:58 2025-04-22 UTC+2

التحليل الفني لحركة السعر اللحظية لأزواج العملات المتقاطعة AUD/CAD، الثلاثاء 22 أبريل 2025.

مع حركة سعر زوج العملات المتقاطع AUD/CAD فوق المتوسط المتحرك الوزني (WMA) لفترة 21 والذي يميل إلى الصعود وظهور التقارب بين حركة سعر AUD/CAD ومؤشر المذبذب العشوائي، فإن ذلك يعطي

Arief Makmur 06:58 2025-04-22 UTC+2

إشارات التداول للذهب (XAU/USD) للفترة من 21 إلى 25 أبريل 2025: البيع تحت مستوى 3,422 دولار (مستوى تشبع الشراء - 8/8 Murray)

وصل مؤشر النسر إلى مستويات الشراء المفرط. ومع ذلك، يمكن أن يصل المعدن إلى الارتفاع حول 8/8 Murray، والذي يمثل حاجزًا قويًا للذهب. أسفل هذه المنطقة، قد تكون لدينا

Dimitrios Zappas 17:23 2025-04-21 UTC+2

التحليل الفني لحركة السعر اللحظية لأزواج العملات المتقاطعة EUR/GBP، الاثنين 21 أبريل 2025

من خلال ما يظهر على الرسم البياني لمدة 4 ساعات، يبدو أن زوج العملات المتقاطع EUR/GBP يتحرك فوق المتوسط المتحرك الأسي (100)، مما يشير إلى أن المشترين يسيطرون

Arief Makmur 04:19 2025-04-21 UTC+2

التحليل الفني لحركة السعر اللحظية لأزواج العملات الرئيسية USD/JPY، الاثنين 21 أبريل 2025.

مع ظهور التقارب بين حركة سعر زوج العملات الرئيسي USD/JPY مع مؤشر Stochastic Oscillator وموقع EMA (100) الذي يقع فوق السعر، فإن زوج USD/JPY لديه إمكانية لمواصلة ضعفه في المستقبل

Arief Makmur 04:19 2025-04-21 UTC+2

توقعات الفوركس 18/04/2025: اليورو/الدولار الأمريكي، الجنيه الإسترليني/الدولار الأمريكي، الذهب والبيتكوين

روابط مفيدة: مقالاتي الأخرى متوفرة في هذا القسم دورة InstaForex للمبتدئين التحليلات الشائعة افتح حساب تداول مهم: يجب على المبتدئين في تداول الفوركس أن يكونوا حذرين للغاية عند اتخاذ القرارات

Sebastian Seliga 10:18 2025-04-18 UTC+2

الذهب: استمرار حالة عدم اليقين يدعم أسعار الذهب

تستمر أسعار الذهب في تلقي الدعم وسط ضبابية عدم اليقين المحيطة بمسار الحروب الجمركية التي بدأها دونالد ترامب. لقد ارتفعت أسعار الذهب بشكل شبه عمودي لمدة أربعة أشهر. المحرك الرئيسي

Pati Gani 11:49 2025-04-17 UTC+2
لا تستطيع التحدث الآن؟
اطرح سؤالك في الدردشة.
Widget callback
 

Dear visitor,

Your IP address shows that you are currently located in the USA. If you are a resident of the United States, you are prohibited from using the services of InstaFintech Group including online trading, online transfers, deposit/withdrawal of funds, etc.

If you think you are seeing this message by mistake and your location is not the US, kindly proceed to the website. Otherwise, you must leave the website in order to comply with government restrictions.

Why does your IP address show your location as the USA?

  • - you are using a VPN provided by a hosting company based in the United States;
  • - your IP does not have proper WHOIS records;
  • - an error occurred in the WHOIS geolocation database.

Please confirm whether you are a US resident or not by clicking the relevant button below. If you choose the wrong option, being a US resident, you will not be able to open an account with InstaForex anyway.

We are sorry for any inconvenience caused by this message.